Power Query - All you need to know.
- Chris Farr
- Jan 21, 2021
- 3 min read
Updated: Apr 7, 2021

If you are new to loading data into Excel or Power BI, then you may be unfamiliar with what Power Query is, what it’s for and its capabilities.
Power Query is a piece of no code software (although you can use code should you wish) that sits within both Excel and Power BI that allows you to automate data loading and manipulation in the background.
What that really means is that Power Query is the place where you can set a series of steps to clean up your data and get it ready to be used, all without using any formulae or any code.
The Advantages of Power Query
Before Power Query was introduced as an Excel ad in for 2010, the process of cleaning data was invariably done in a couple of ways, either through Macros or through manual manipulation every time, and it's quite possible that if you’re reading this, you are still in one of these camps.
Either process tends to involve setting up a workflow that removes columns, changes formatting, removes errors and in more advanced cases combines data together. The aim of this type of workflow is designed to simply clean up some data so that it can be used in a report of some kind.
It is this type of workflow that Power Query solves for and automates in a simple and straightforward way.
Accessing Power Query
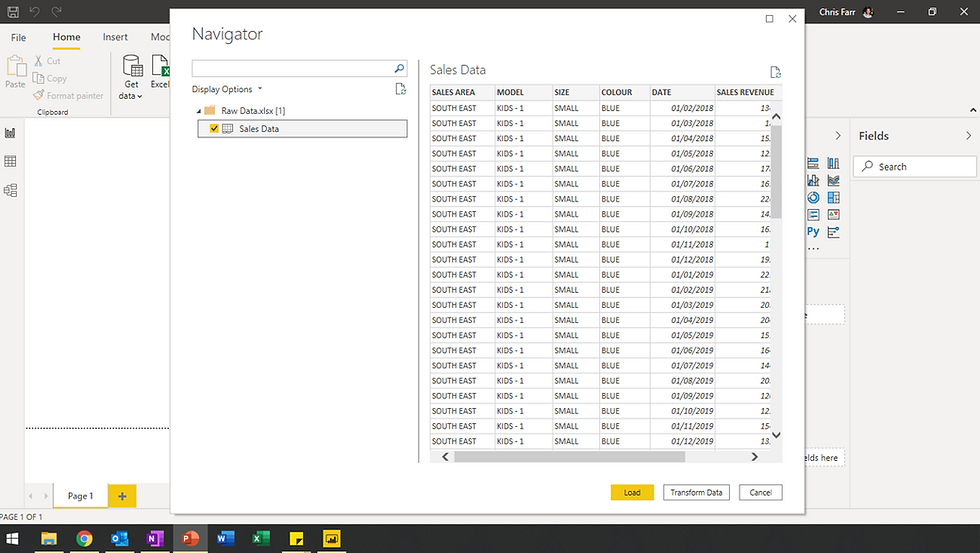
If you have data that you wish to use on a Power BI Report, or within Excel, it would be loaded through Power Query. When you select ‘Get Data’ and select a file, database or online source, the Power Query window will open and allow you to manipulate the data before loading it in.

It is possible to load in the data without making any changes, but in most cases, it's necessary to make some changes to tidy up the data. This is done by selecting 'Transform Data'.
Once you have the Power Query window open, you can then add a series of steps that will be recorded and run every time the data is refreshed.
Types of Functions
There are many things that Power Query can do without entering any code, and even more that can be done should you want to enter some code. But for normal use the no code option will be sufficient.
As Power Query is a Microsoft program, there is a familiar layout to the window, with ribbons at the top full of functions that can be used. Removing columns, changing formatting, unpivoting columns are all available from both the ribbon at the top and by right-clicking on specific columns.
Each step that is entered appears on the right-hand side, under ‘applied steps’. These steps appear in the order that they were entered and help show a history of what has been done.

Having these steps listed on the side is useful for two reasons. Firstly, you can remove a set by clicking on the ‘x’ to the side of the description. This means that if you did something you weren’t happy with you can undo it quickly, or if you wanted to see what a function did you can test it without worrying about how to undo it. Secondly, you can click on any of the steps and see what the data looked like at that step. So if you wanted to go back and check what the step changed, you could simply click on it and the one before it to see the differences.
Additionally, you can go back into the query and make any necessary amendments as things evolve and need to be updated.
Updating your data
Once you have processed your data through Power Query and loaded it into either Power BI (where it will be available to create reports) or into Excel (where it will be available for use in a pivot table), you can refresh the data from its source whenever you need to.
Each time you refresh the data, the same steps you entered into Power Query will be followed automatically, and the data updated in the same way. This will not only save you time if you were previously doing this manually using formulae or save you from using any code if you were using a macro.
Simple to set up, quick to learn and easy to update.
Want to know more about how Power Query can help you with your data manipulation and modelling then talk to one of the Sontai Team today for a Free Consultation.
